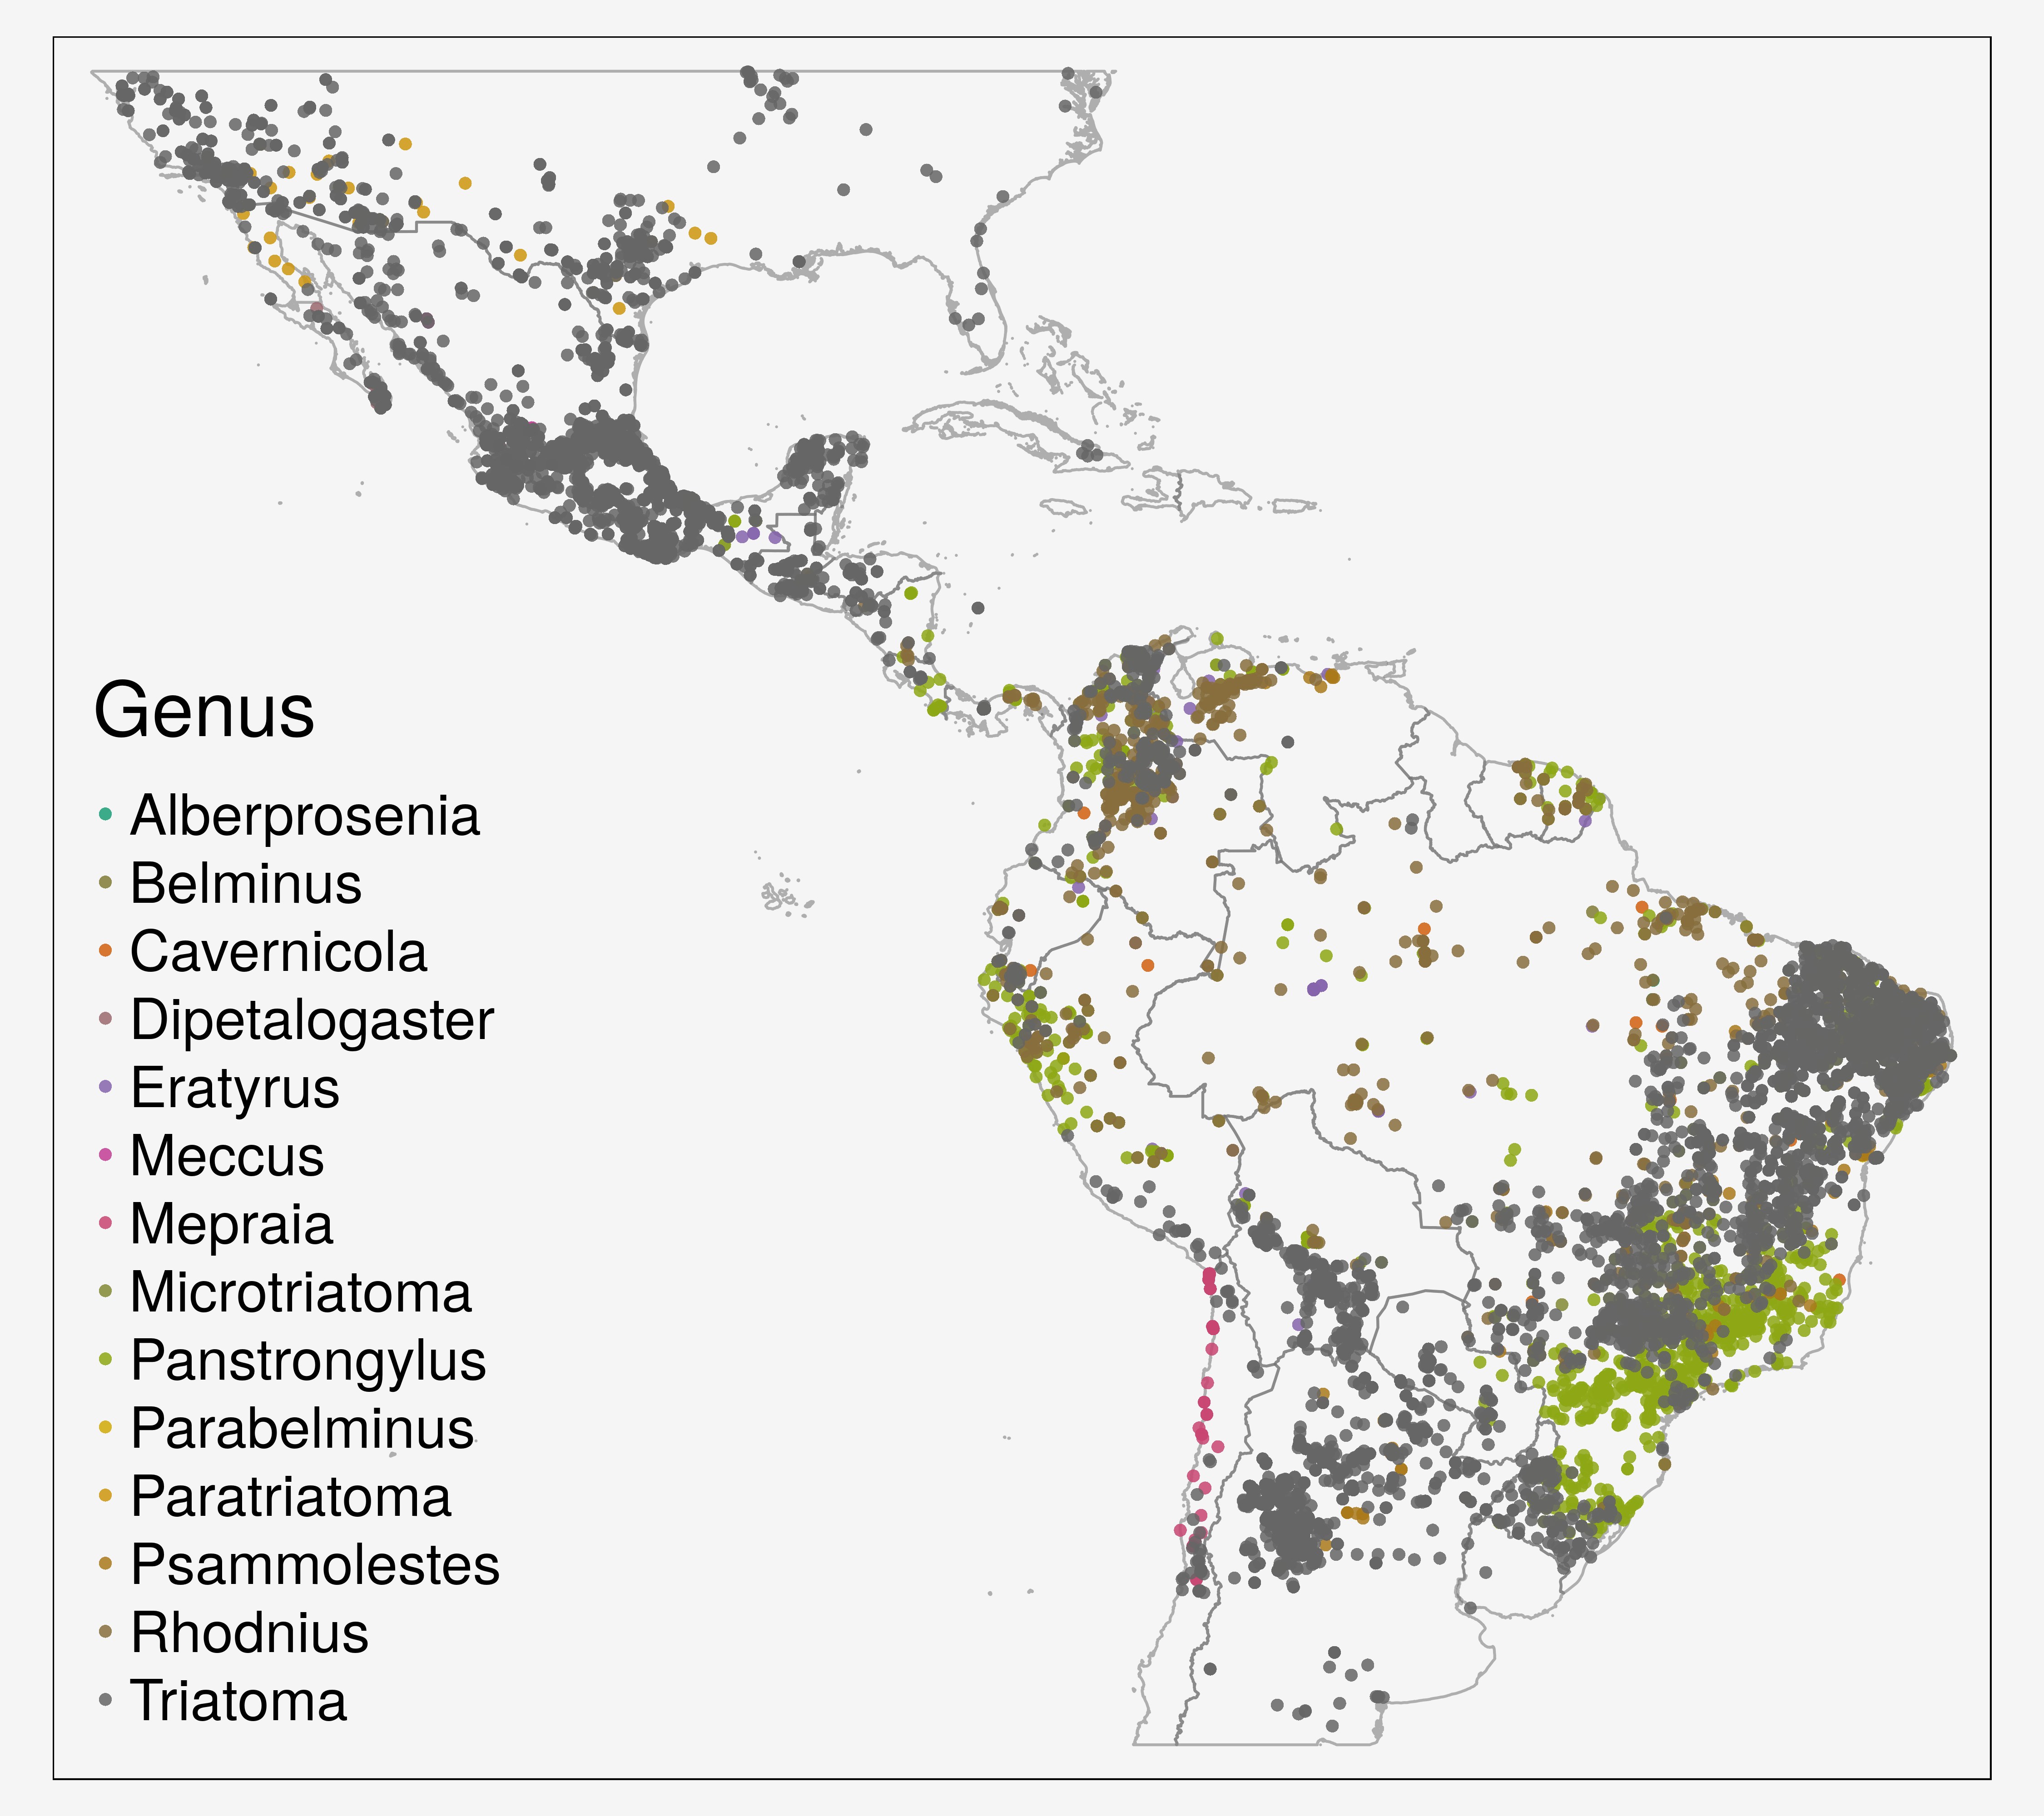
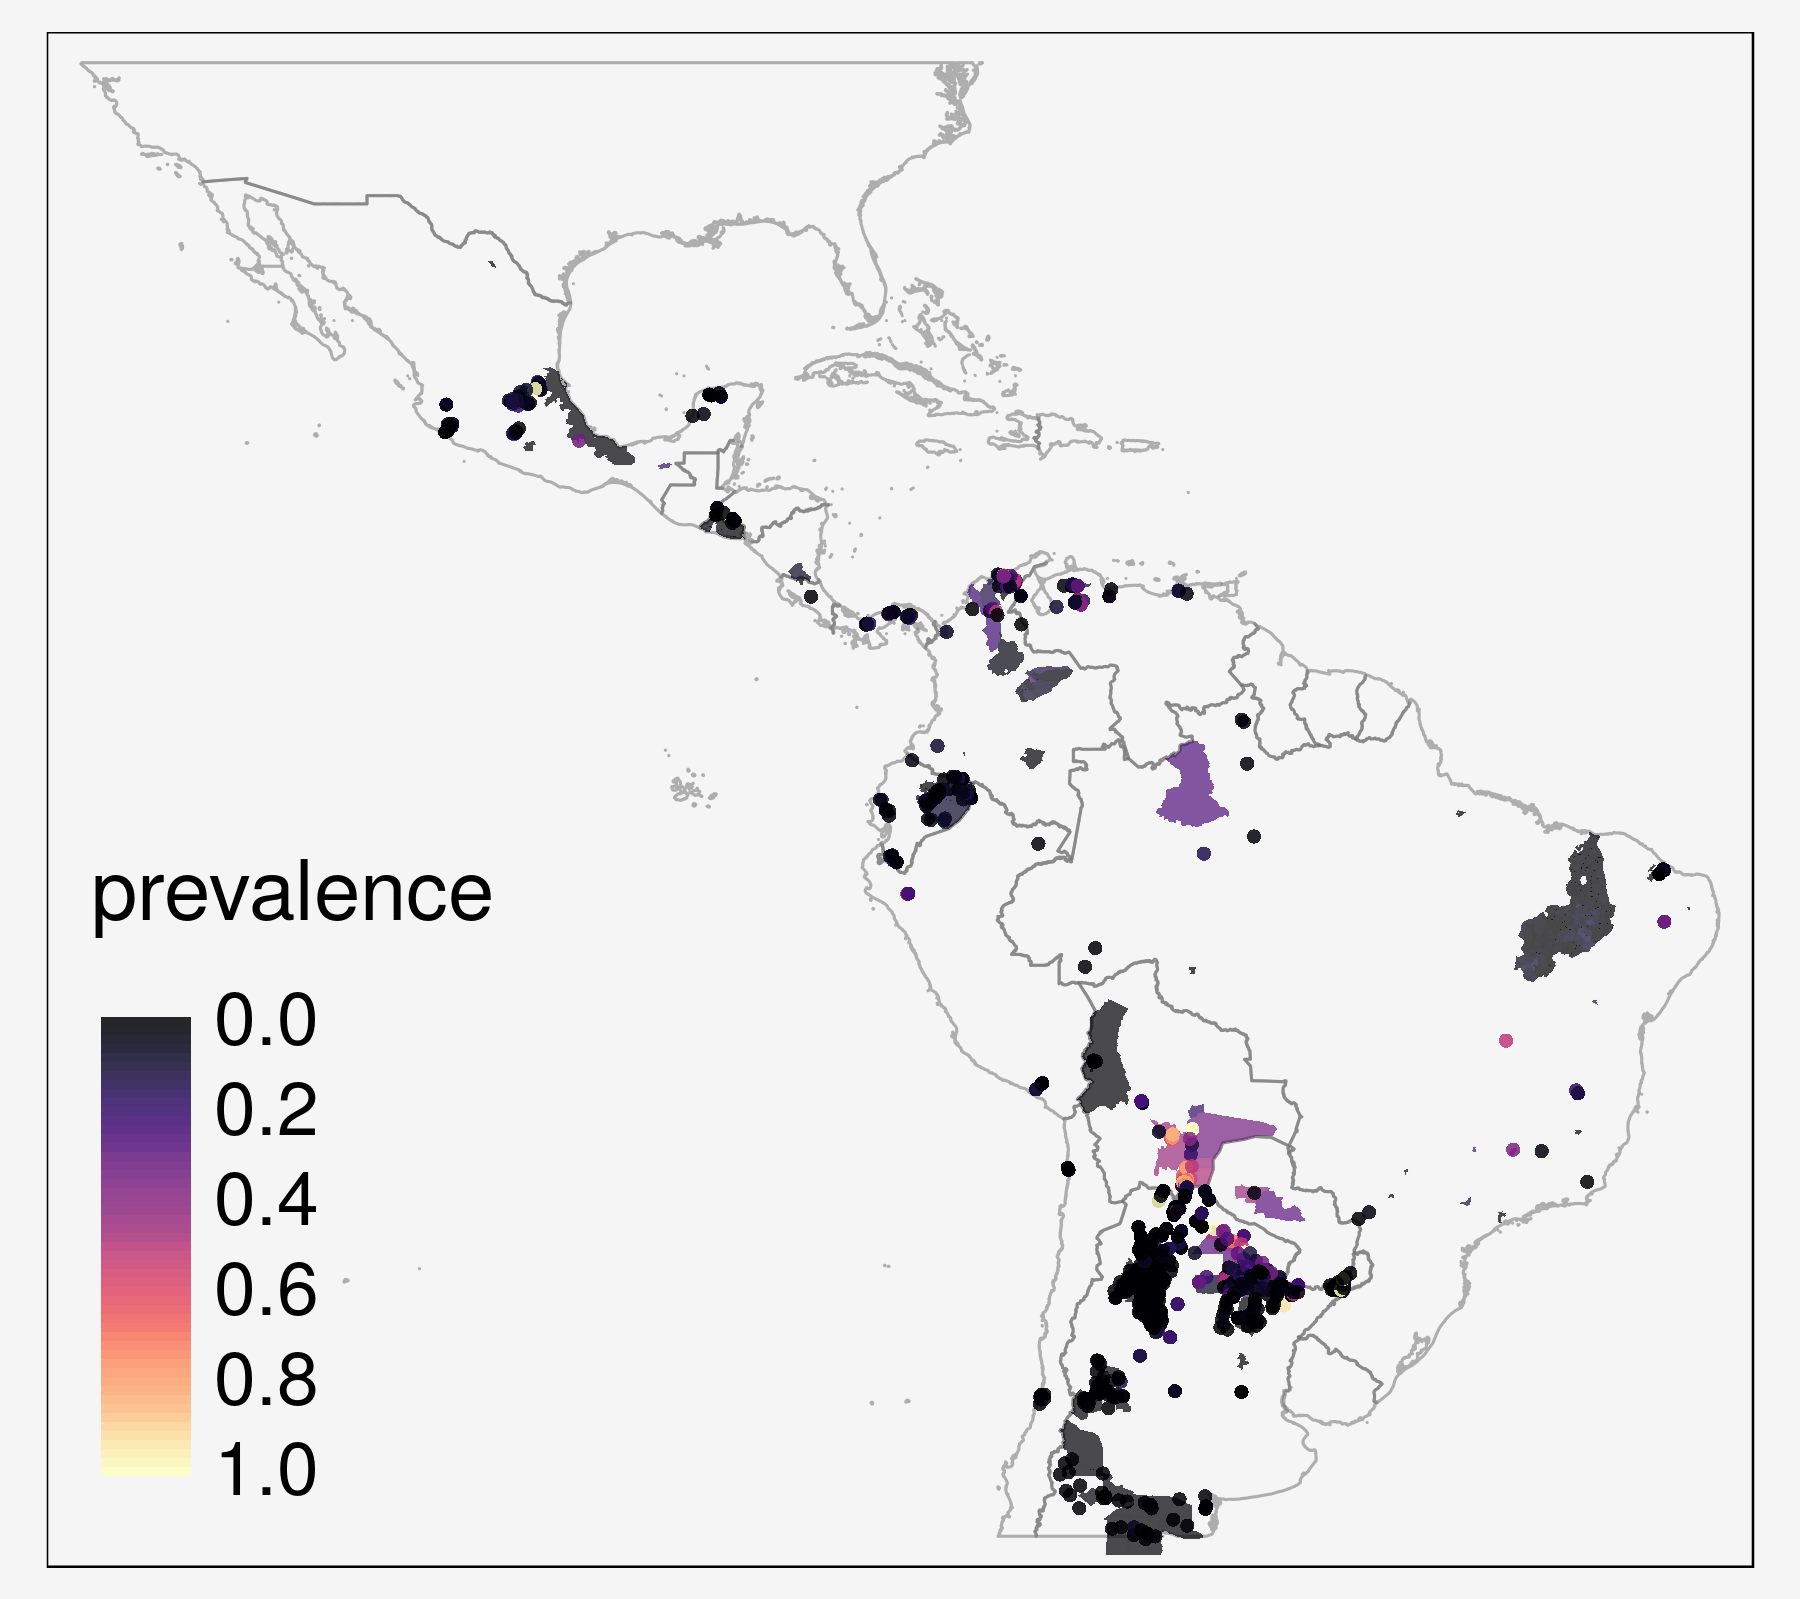
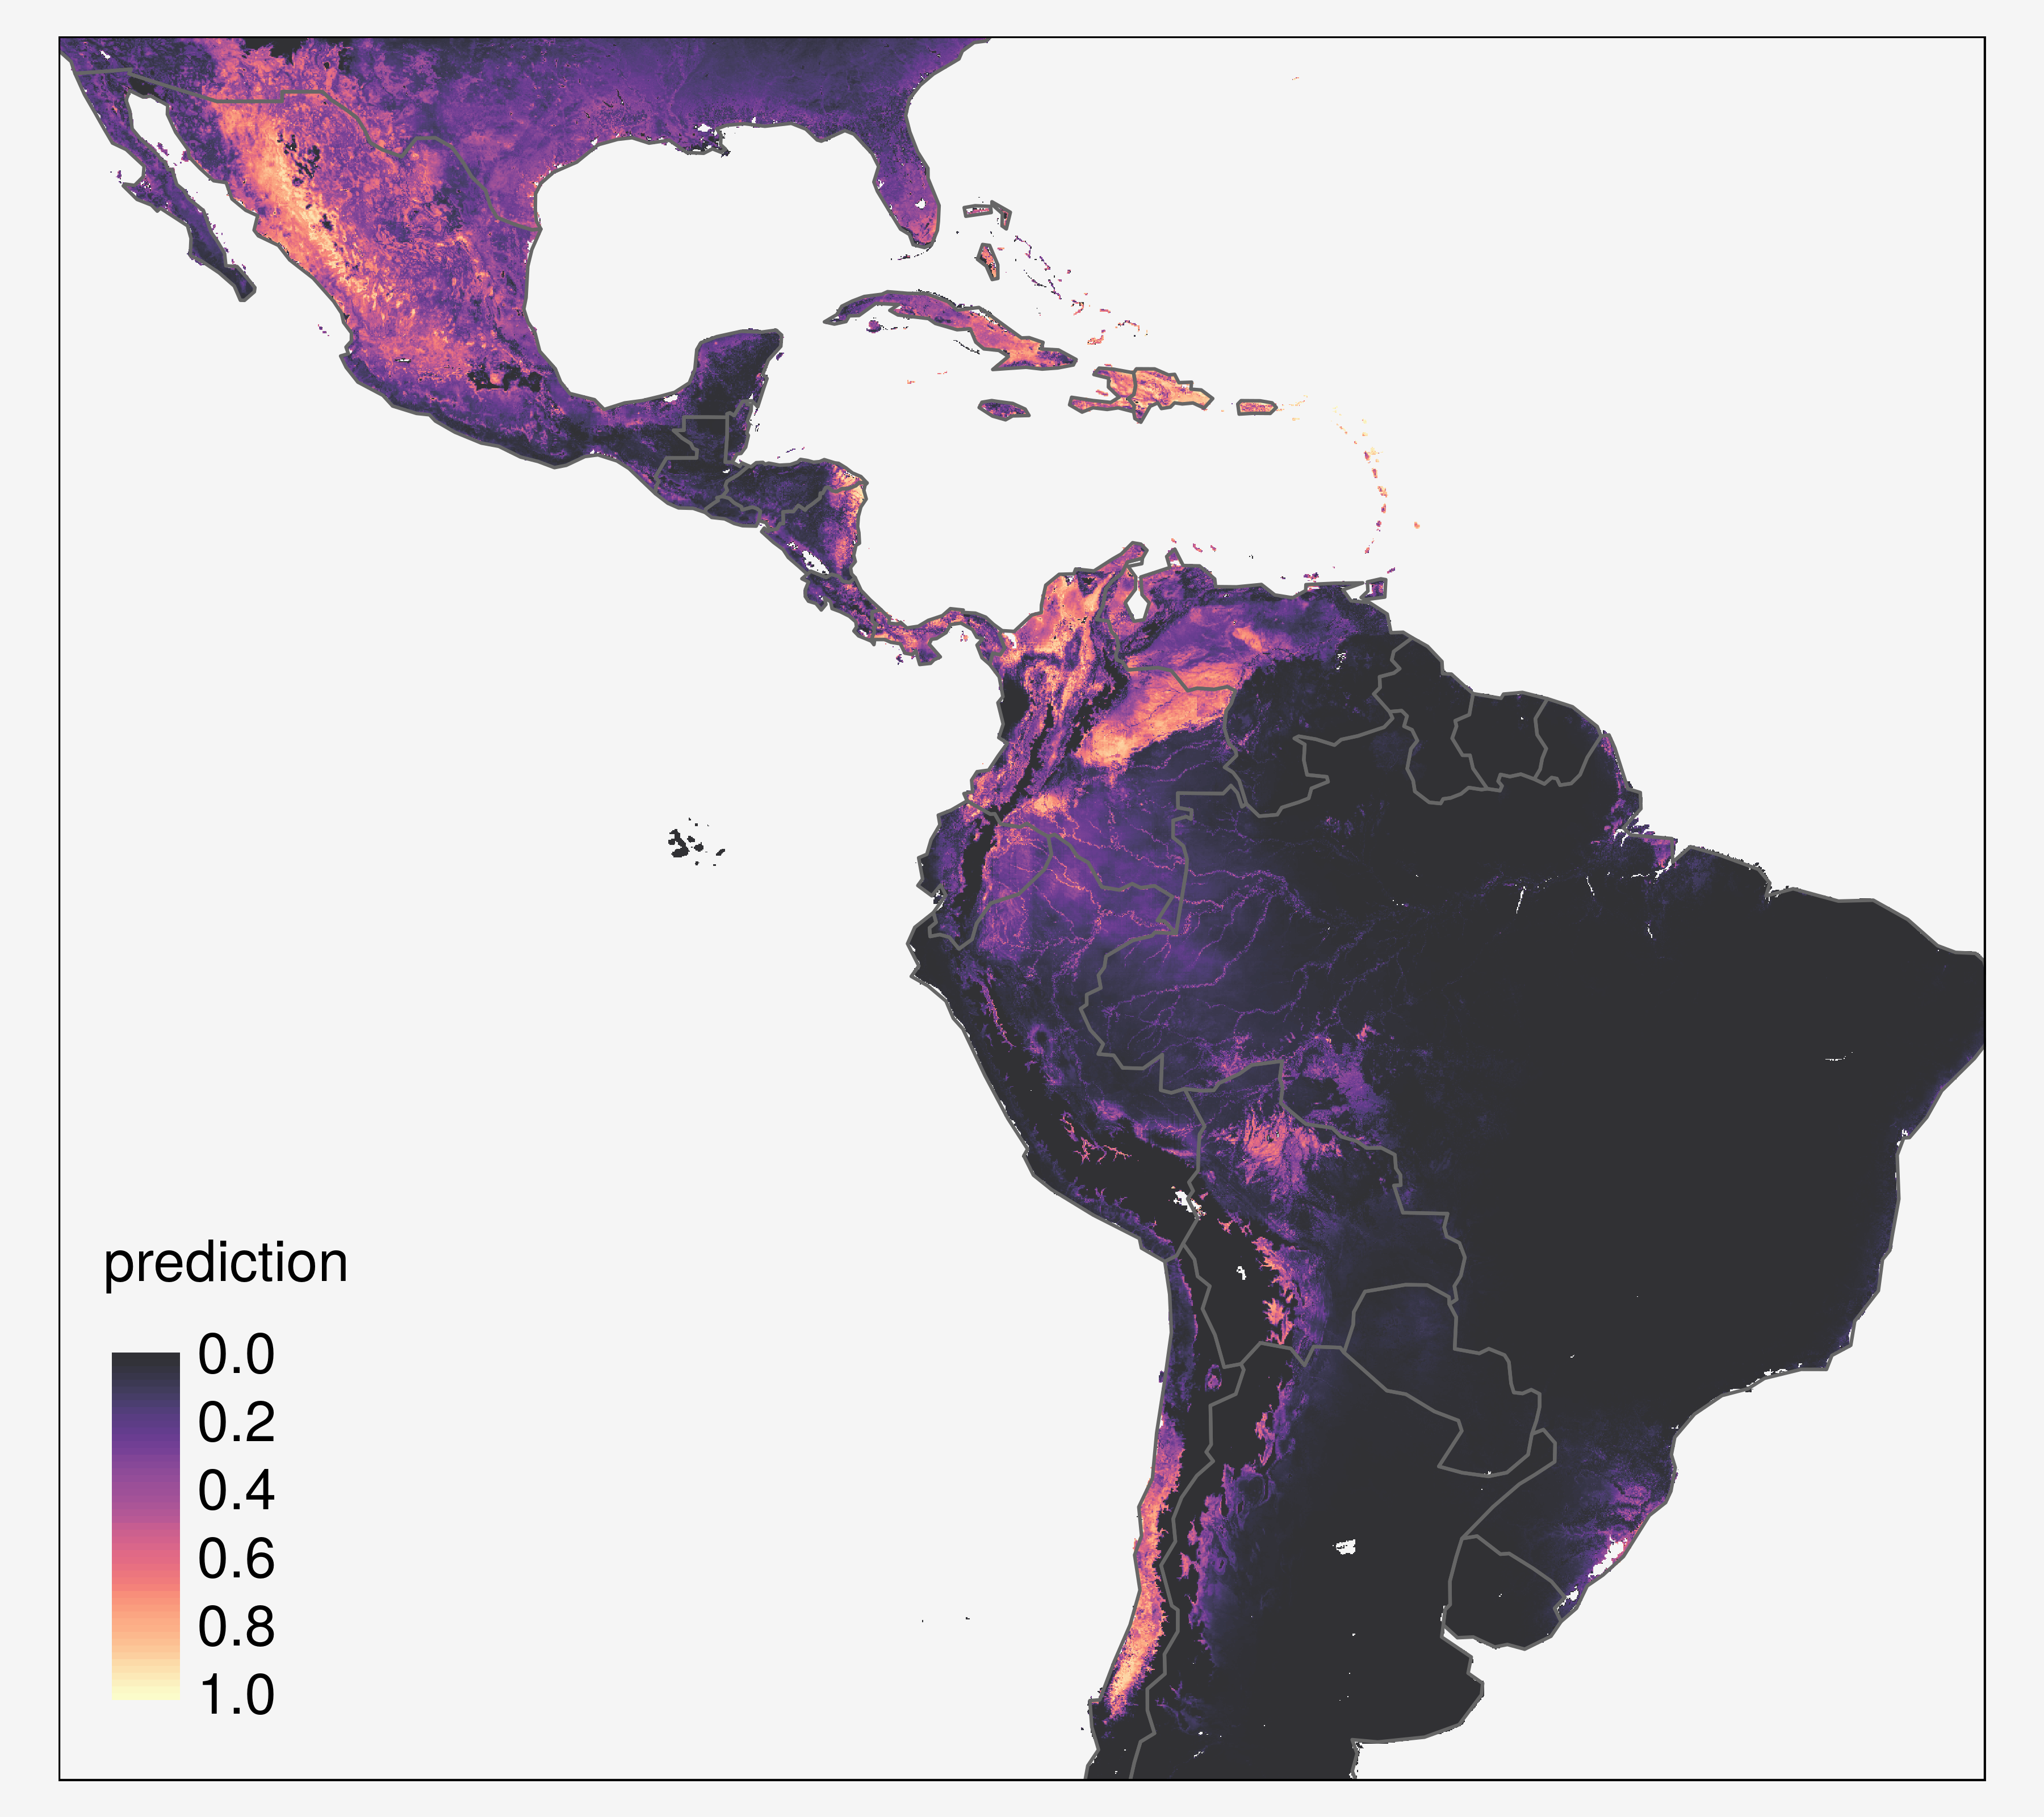
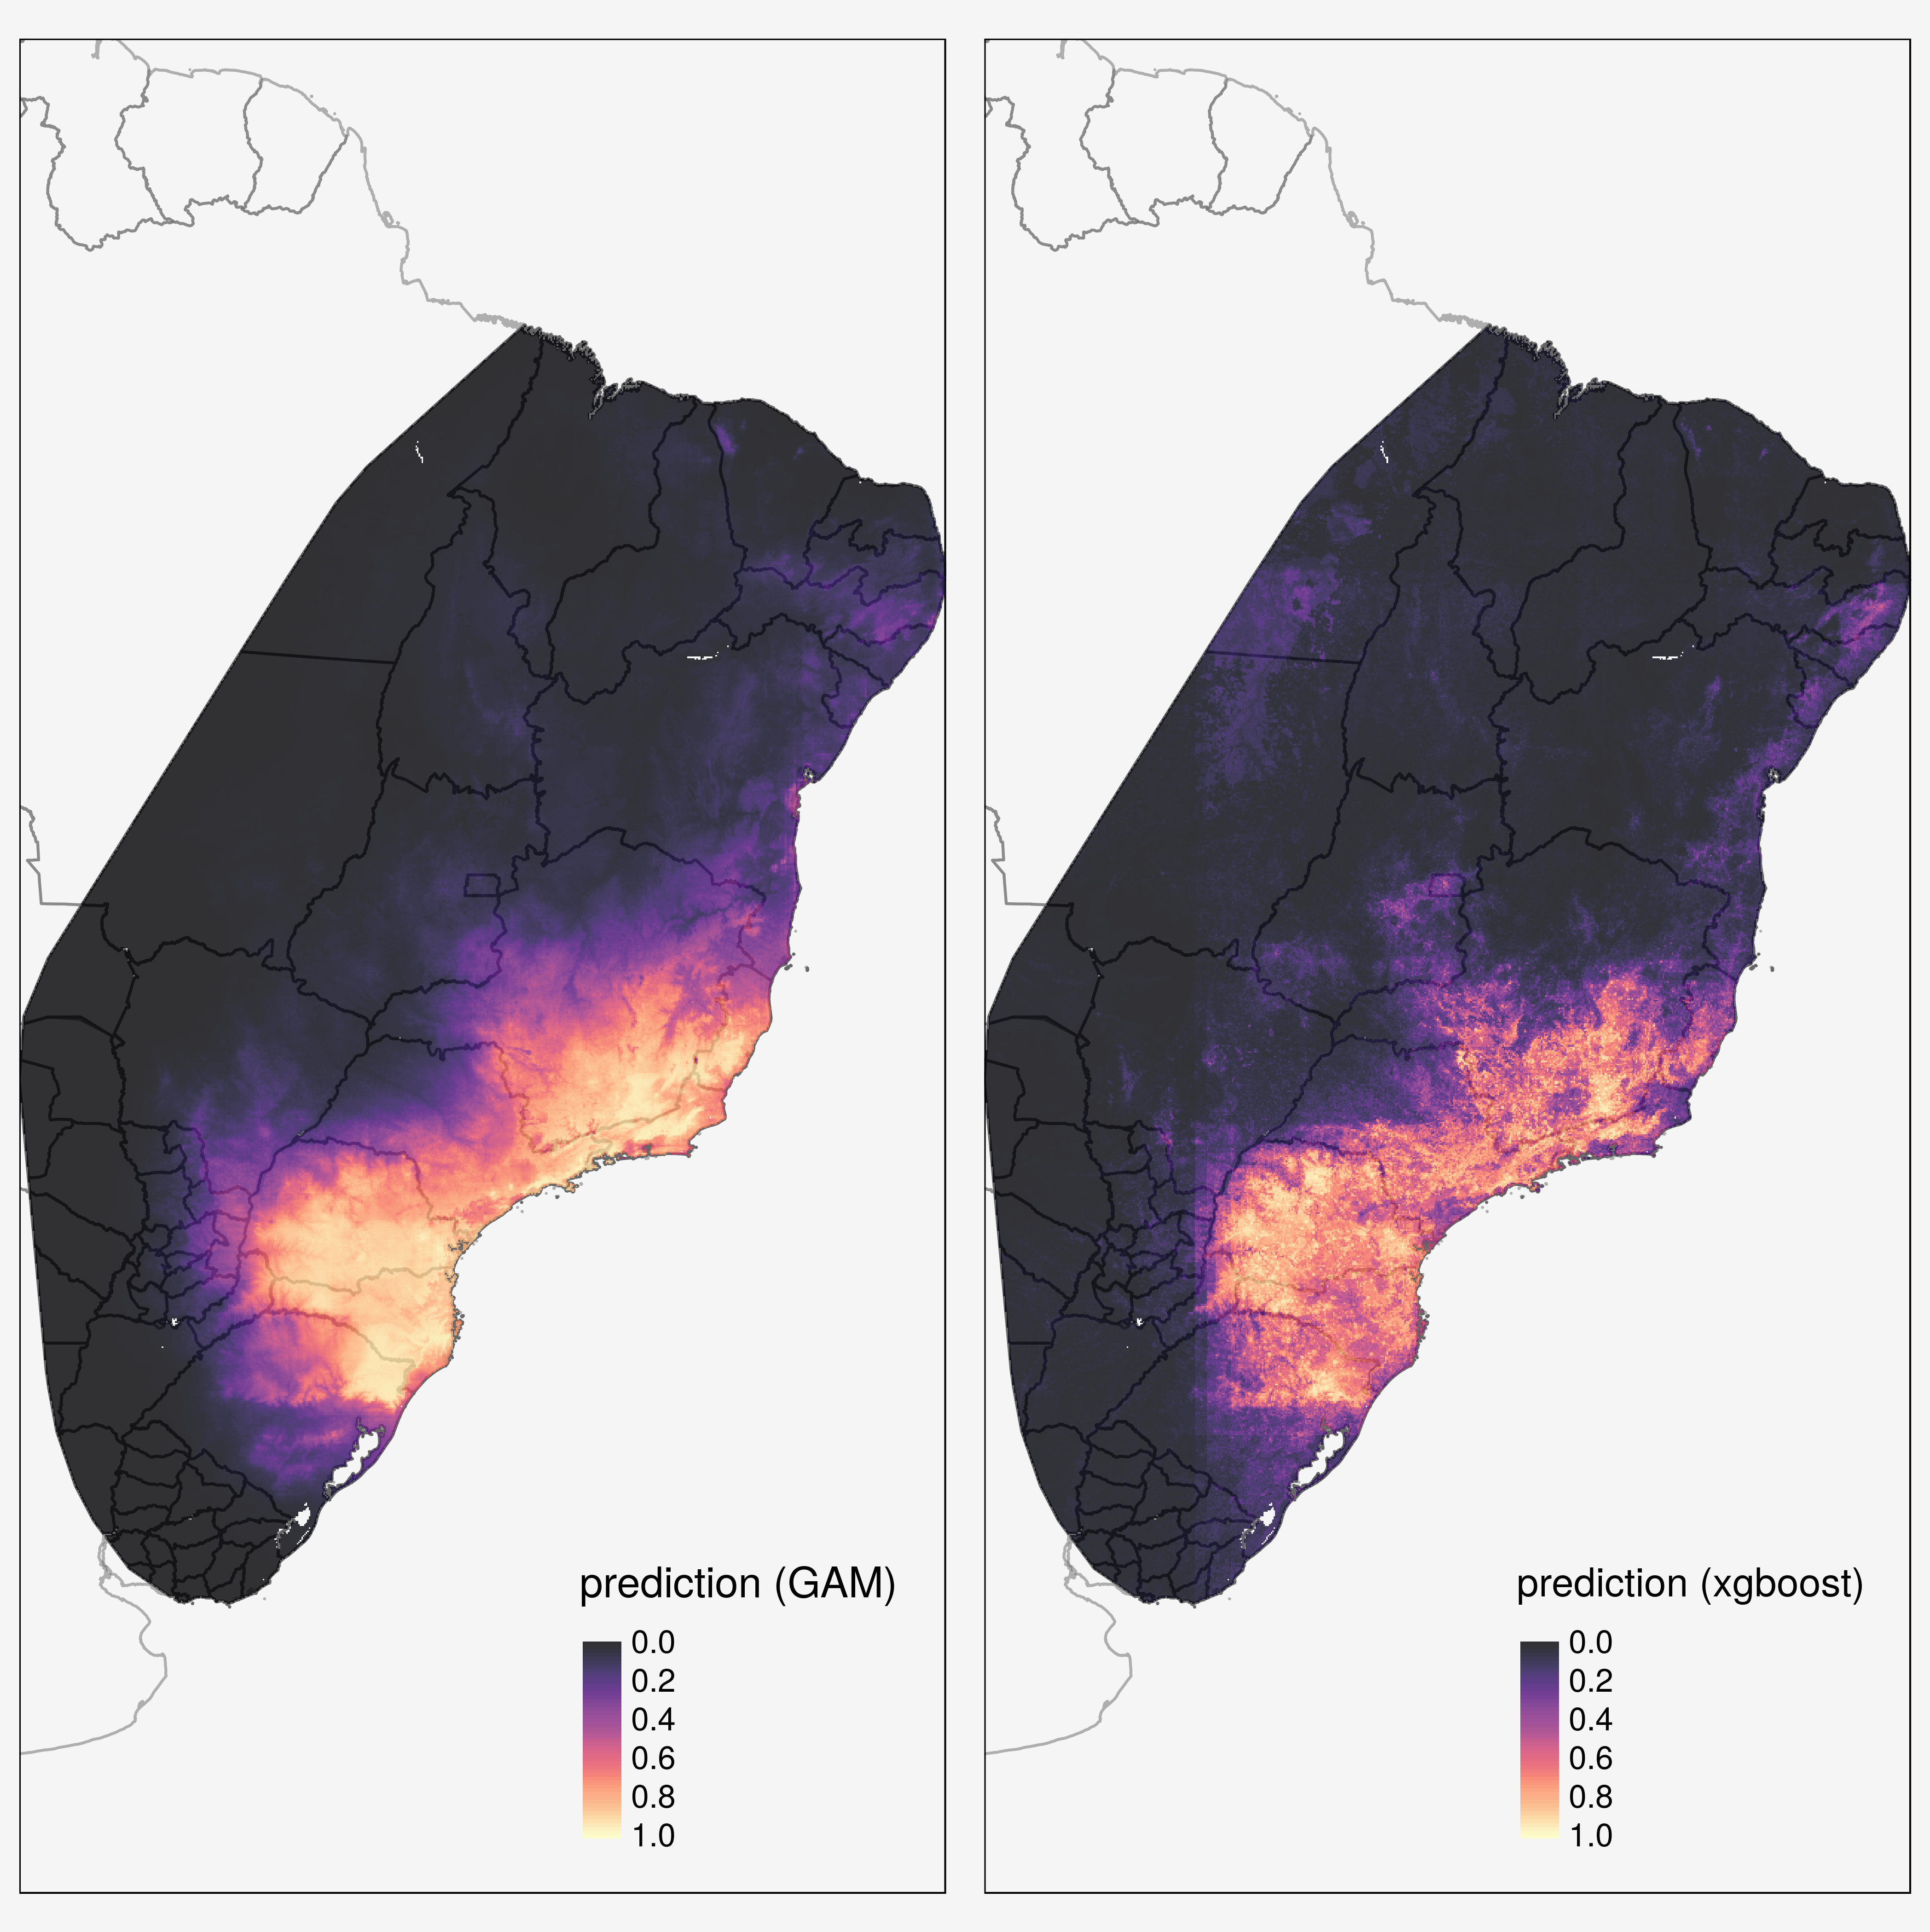
2. Infection prevalence in vectors
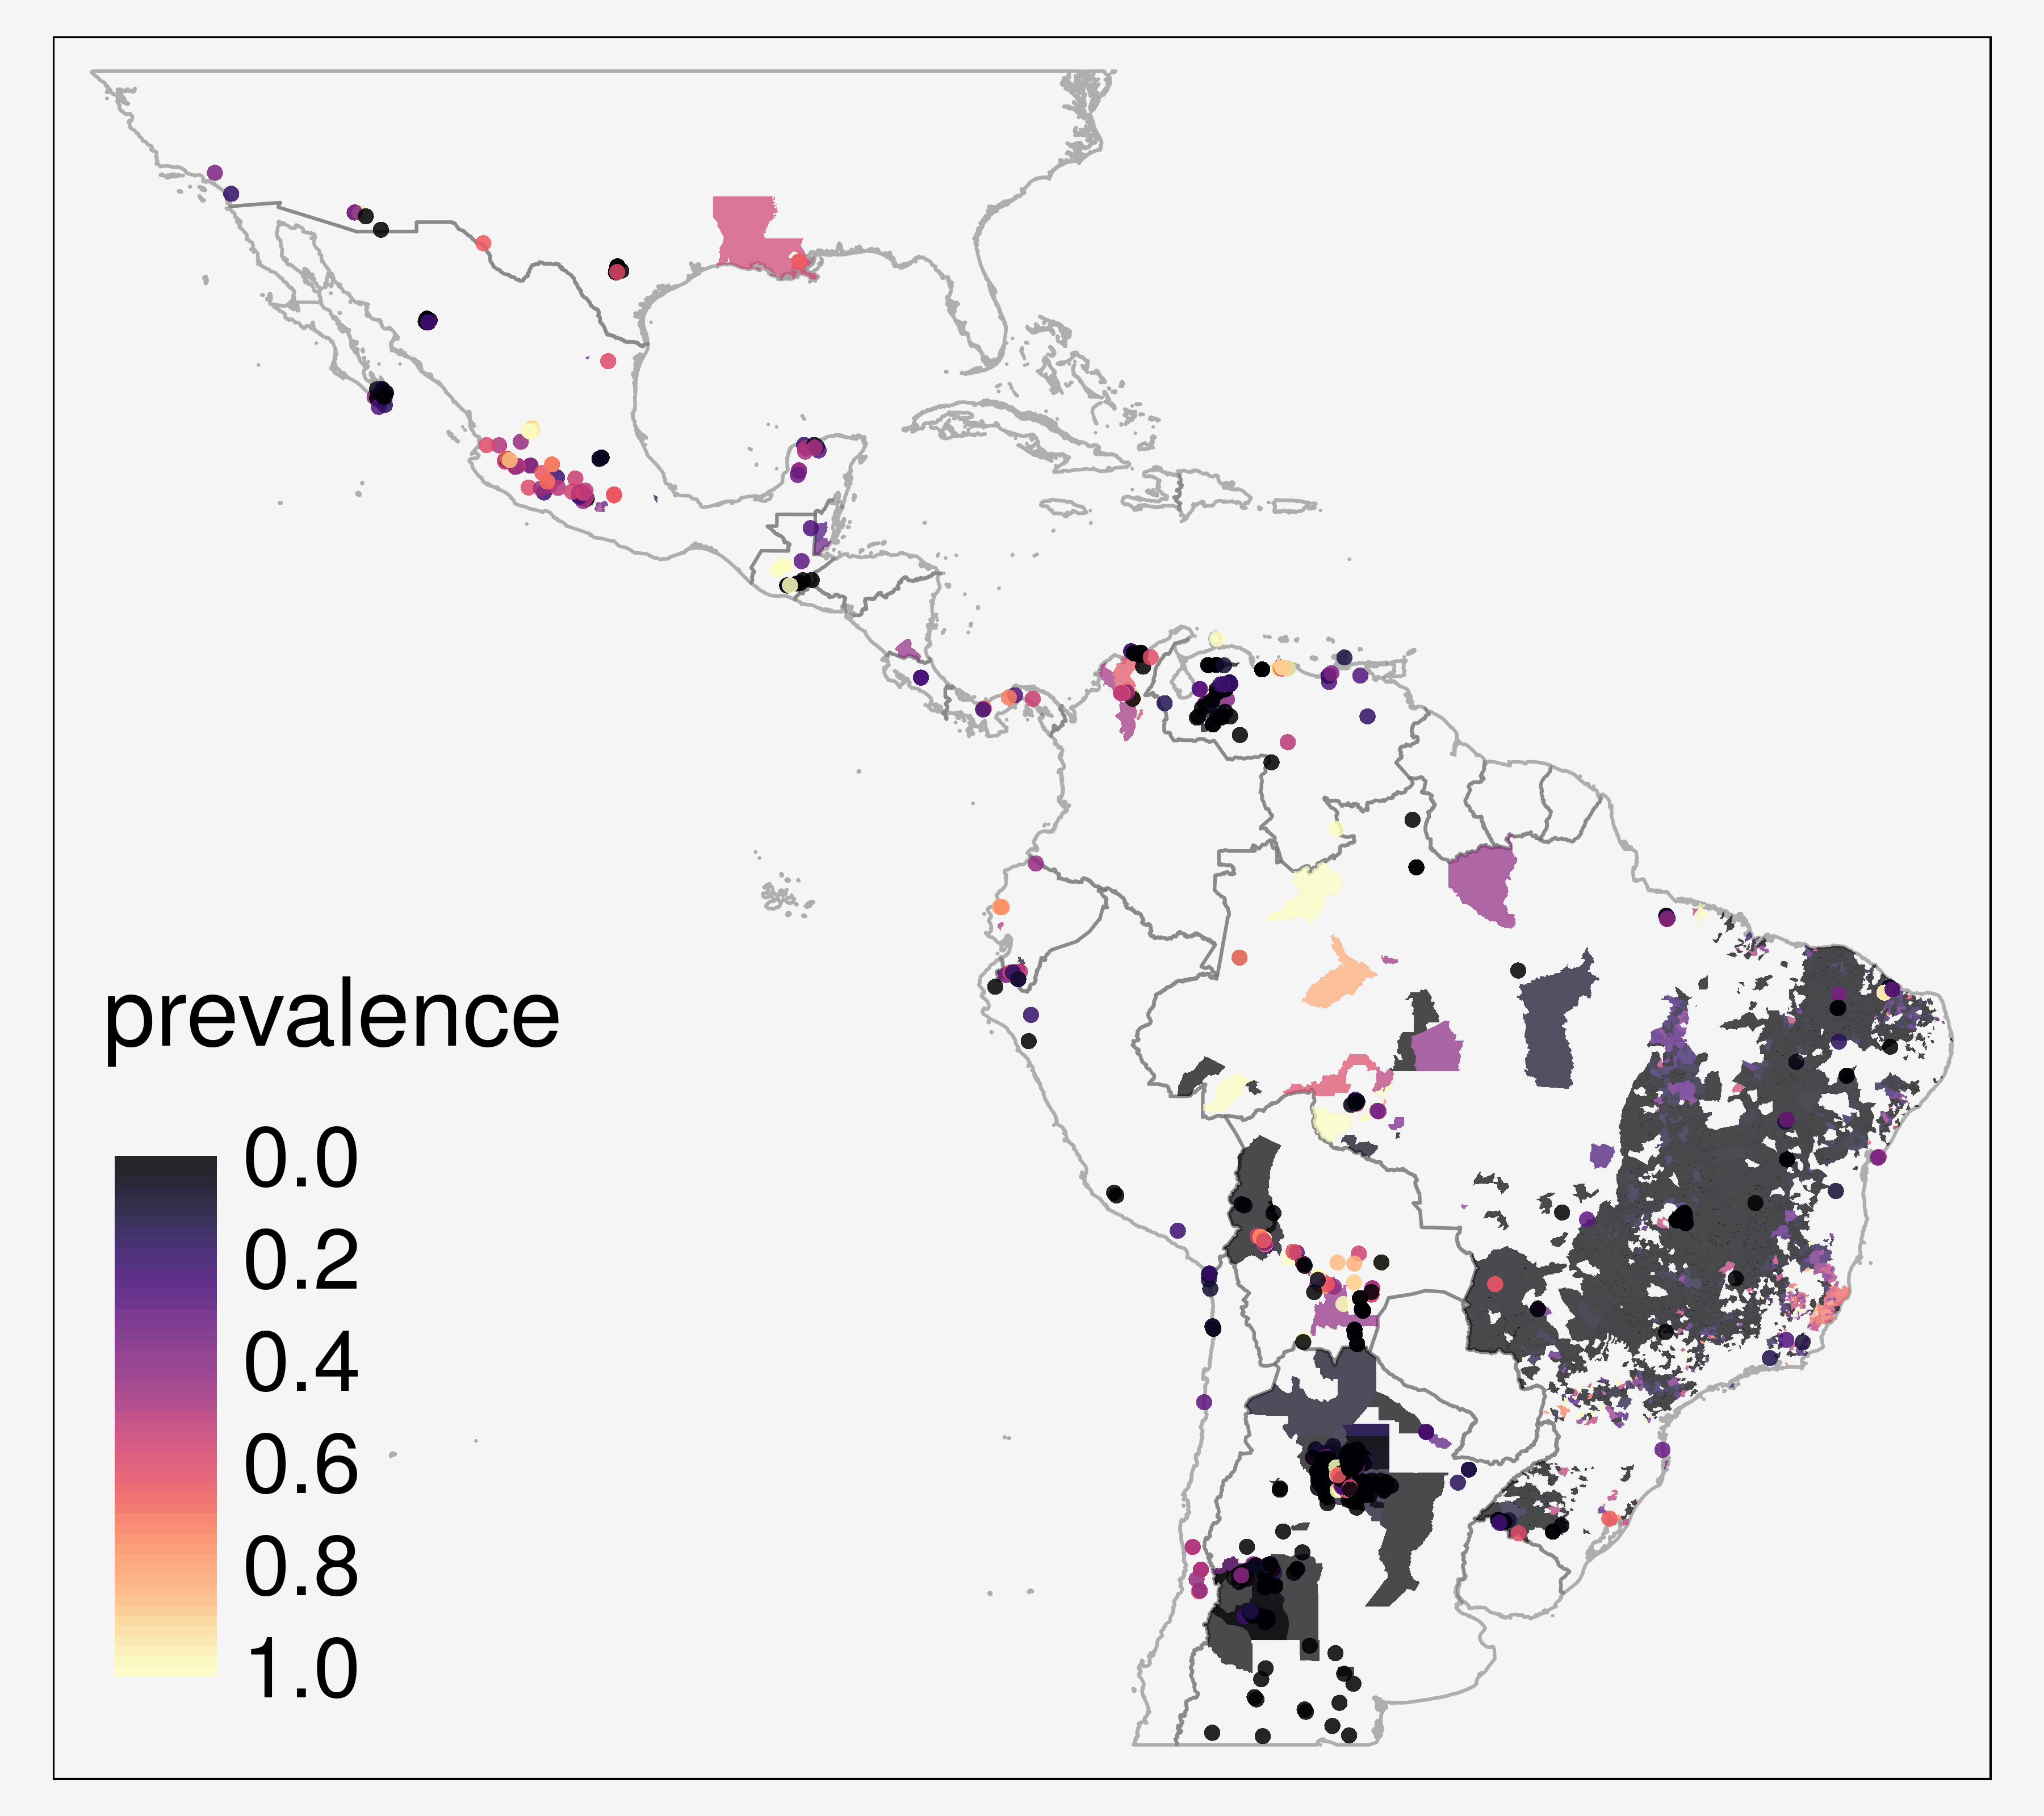
- point- and
polygon-level data - spatial sparseness
![]()
![]()
![]()
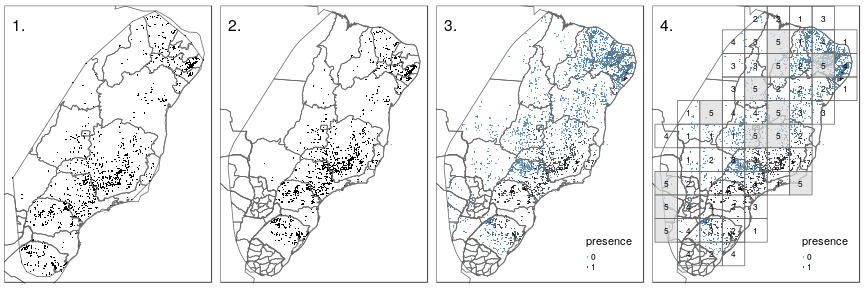
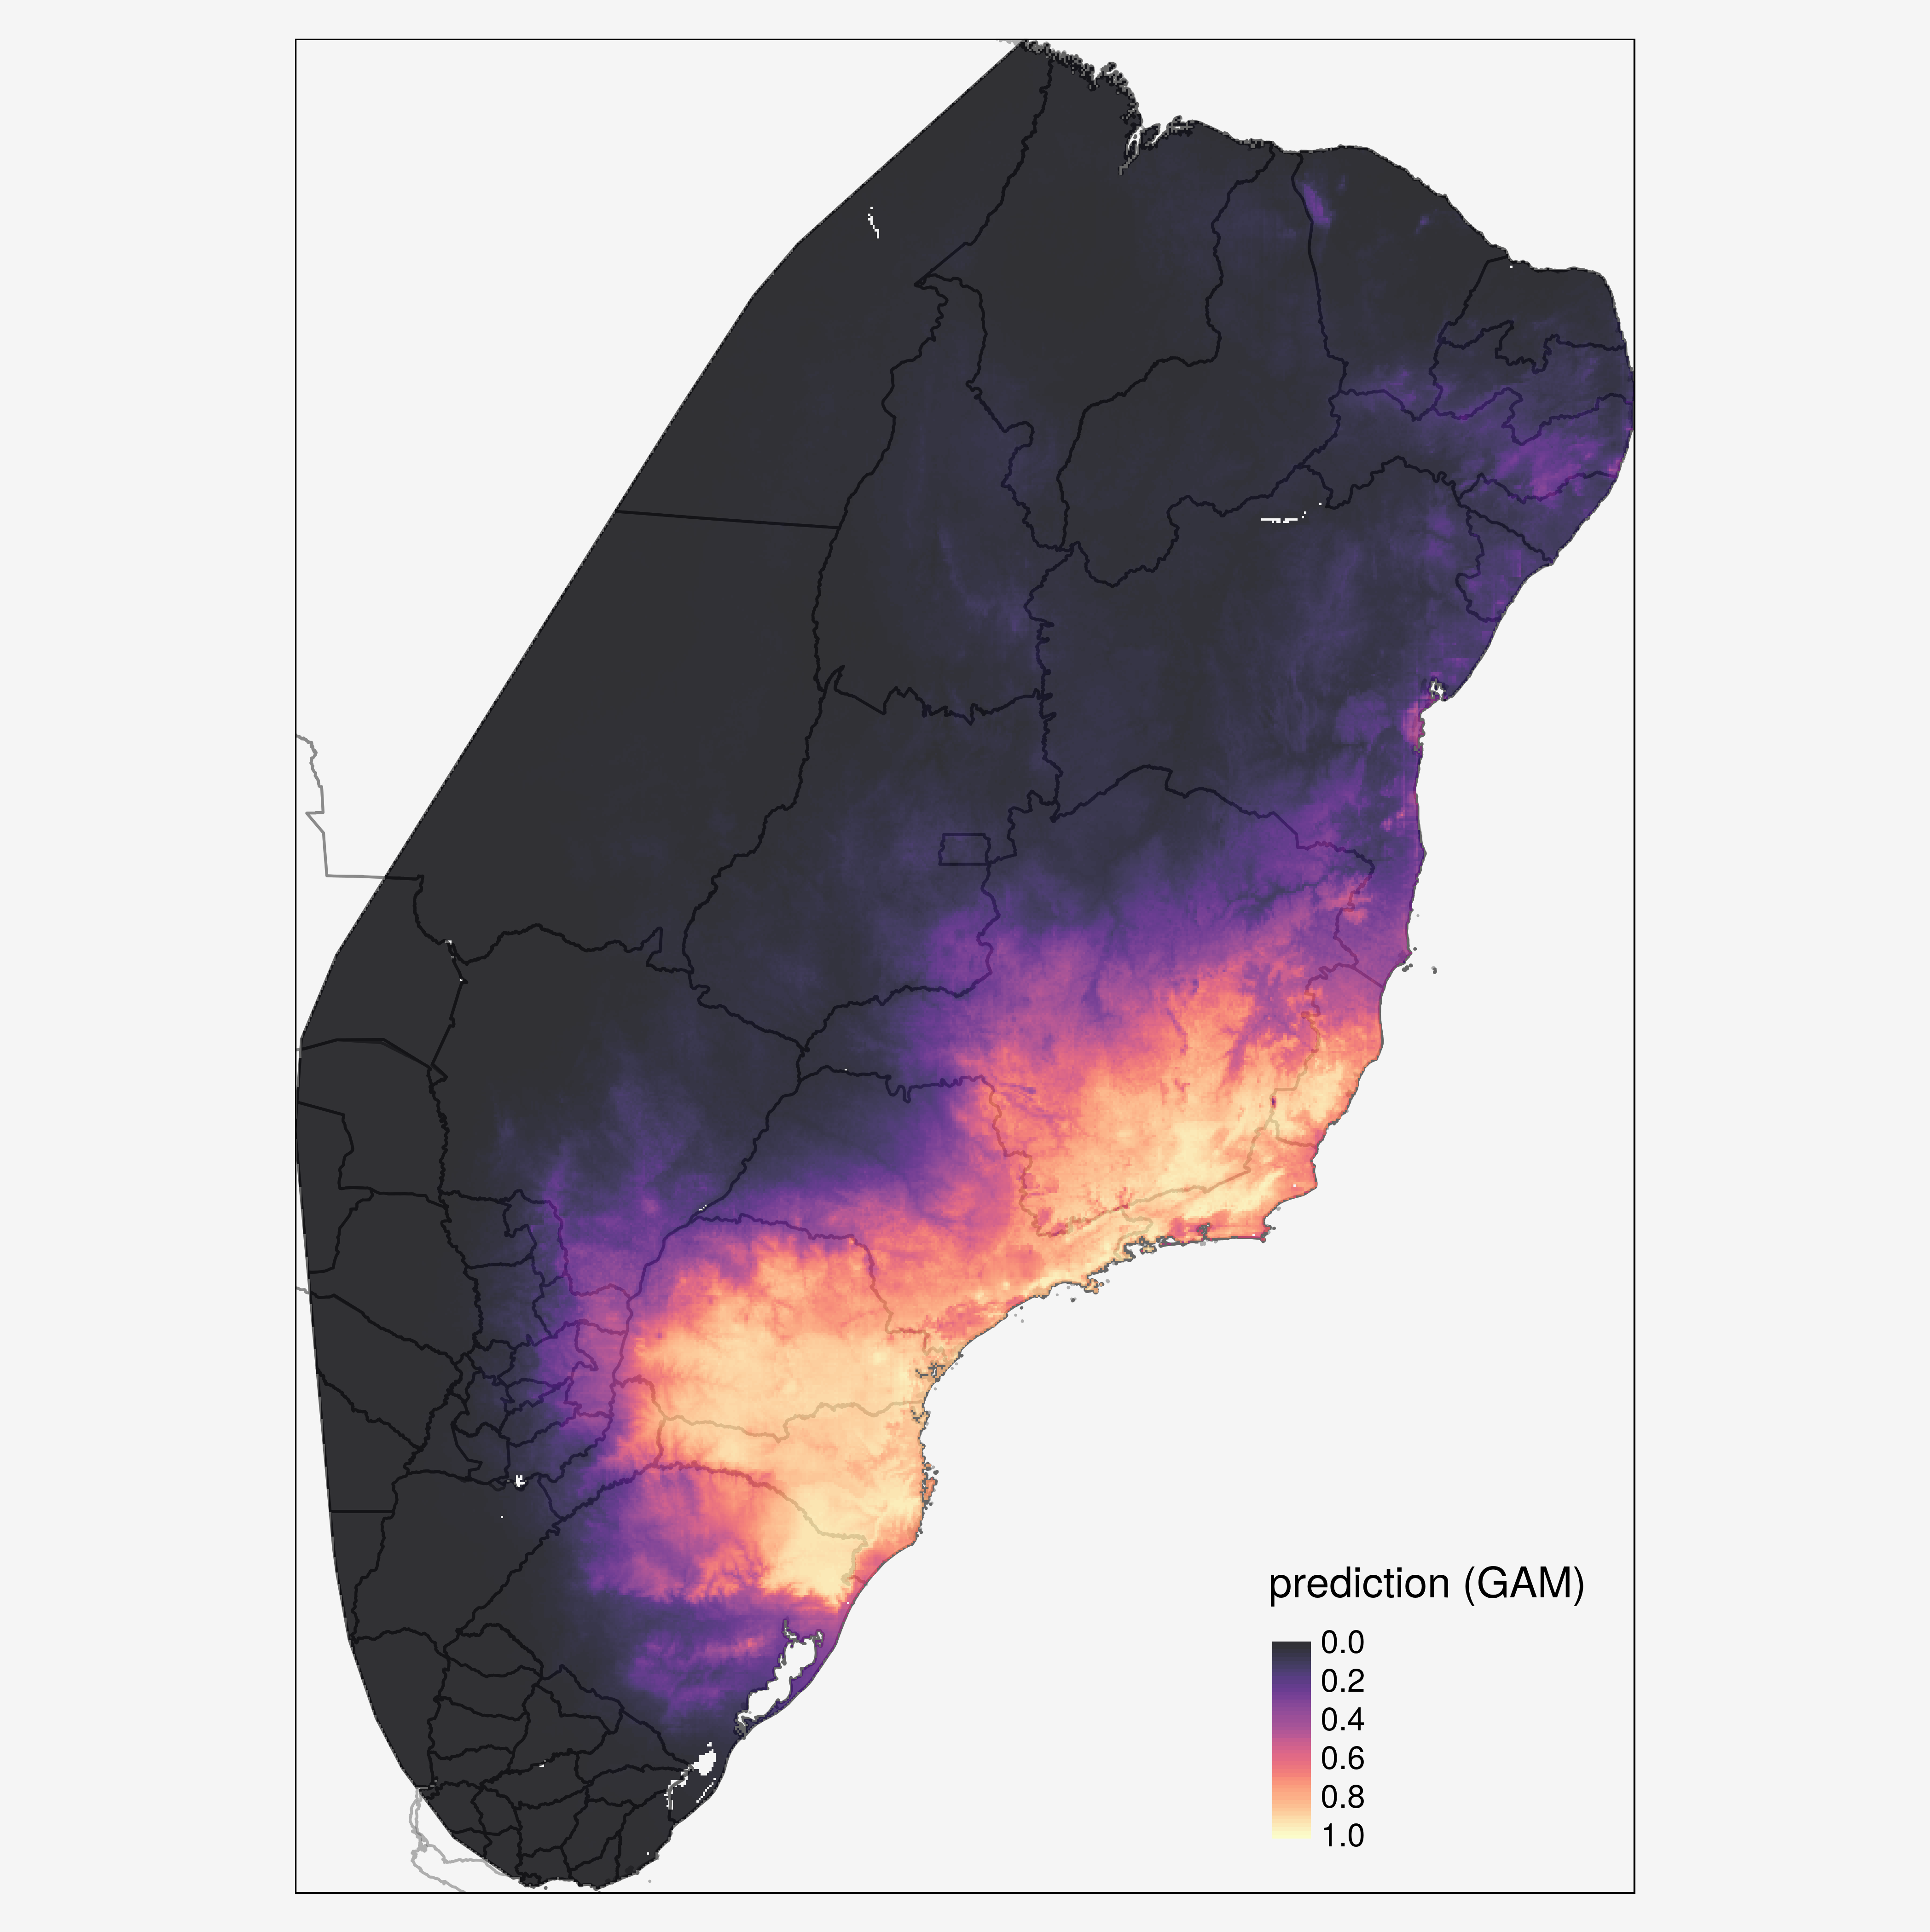
Convex hull around species presence locations
Extended convex hull
Define absences as reported presence locations of all other species
Set up spatial block-wise cross-validation (each fold 1-5 same proportion of presences and absences)
Keyboard shortcuts
| ↑, ←, Pg Up, k | Go to previous slide |
| ↓, →, Pg Dn, Space, j | Go to next slide |
| Home | Go to first slide |
| End | Go to last slide |
| Number + Return | Go to specific slide |
| b / m / f | Toggle blackout / mirrored / fullscreen mode |
| c | Clone slideshow |
| p | Toggle presenter mode |
| t | Restart the presentation timer |
| ?, h | Toggle this help |
| Esc | Back to slideshow |